 black hat
No one wants to spend millions of dollars to protect a company if the actual damage in the event of an incident would not exceed several thousand. And it’s just as foolish to cut corners to save $100 on security if the potential damages of a data leak could total hundreds of thousands of dollars. But what information should you use to calculate the approximate damage a company would incur from a cyberincident, and how do you gauge the actual likelihood of such an incident? At the Black Hat 2020 conference, two researchers — Professor Wade Baker of Virginia Tech and David Seversky, a senior analyst at the Cyentia Institute — presented their view of risk assessment. We found their arguments worthy of further discussion.
Any cybersecurity course worth its salt teaches that risk assessment relies on two main factors: an incident’s probability and its potential losses. But where does that data come from, and, more important, how should it be interpreted? After all, assessing possible losses incorrectly leads to incorrect conclusions, which lead to nonoptimal protection strategies.
Is the arithmetic mean indicative?
Many companies conduct studies of financial losses caused by data breach incidents. Their “key findings” are usually averages of losses of companies of comparable size. The result is mathematically valid, and the figure can look great in catchy headlines, but can we really rely on it to calculate risks?
Present that same data in a graph, with losses along the horizontal axis and the number of incidents that caused the losses along the vertical axis, and it becomes obvious that the arithmetic mean is not the right indicator.
In 90% of incidents, the average losses are less than the arithmetic mean.
If we are talking about the losses that the average business will incur, then it makes more sense to look at other indicators — specifically, the median (the number that divides the sample into two equal parts such that half of the reported figures are higher and half are lower) and the geometric mean (a proportional average). Most companies suffer just such losses. The arithmetic mean can produce a very confusing figure because of a small number of outlying incidents with abnormally large losses.
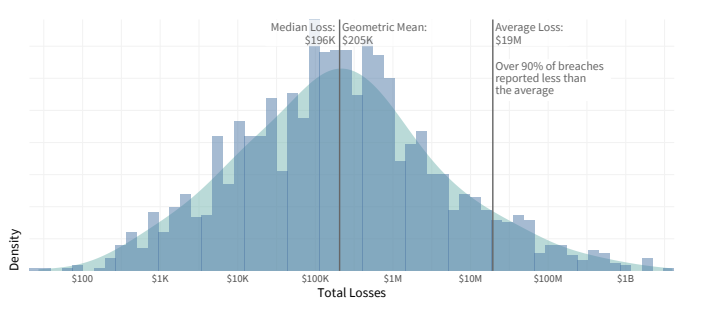
Distribution of losses from data breach incidents. Source
Average cost of a leaked data record
Another example of a questionable “average” comes from the method of calculating losses from data breach incidents by multiplying the number of affected data records by the average amount of damages from the loss of one data record. Practice has shown that this method underestimates the losses of small incidents and seriously overestimates the losses of large ones.
Here’s an example: Some time ago, a news story spread across many analytics sites, claiming that misconfigured cloud services had cost companies nearly $5 trillion. If you research where this astronomical amount came from, it becomes clear that the figure of $5 trillion came from simply multiplying the number of “leaked” records by the average damages from the loss of one record ($150). This latter figure comes from the Ponemon Institute’s 2019 Cost of a Data Breach Study.
However, the story should come with several caveats. First of all, the study did not take all incidents into account. Second, even when we consider only the sample used, the arithmetic mean does not give a clear idea of the losses; it considered only cases of records whose loss would cause damages of less than $10,000 and more then 1 cent. Moreover, it is clear from the study’s methodology that the average is not valid for incidents in which more than 100,000 records were affected. Therefore, multiplying the total number of records that were leaked as a result of incorrectly configured cloud services by 150 was fundamentally wrong.
If this method is to produce a true risk assessment, it needs to include another indicator of the probability of losses depending on the scale of the incident. That would look approximately as follows:

Dependence of the probability of losses on the number of records affected by the incident. Source
The ripple effect
Another factor often overlooked when calculating the cost of an incident is that modern data leaks affect the interests of more than just a single company. In many incidents, the total damages incurred by third-party companies (partners, contractors, and suppliers) exceeds the damages to the company from which the data was leaked.
The number of such incidents increases every year; the general trend of “digitalization” only increases the level of interdependence between business processes at different companies. According to the results of the Ripples Across the Risk Surface study, jointly conducted by RiskRecon and the Cyentia Institute, 813 incidents of this kind resulted in losses for 5,437 organizations. That is, for every company that has suffered a data breach, on average, more than four companies are affected by the incident.
Practical advice
The bottom line is that sensible experts who assess cyberrisks should heed the following advice:
- Do not trust flashy news headlines. Even if many sites carry certain information, they are not necessarily right. Always look at the source that backs up the claim and analyze the methodology of the researchers yourself.
- Use only research results that you understand thoroughly in your risk assessment.
- Keep in mind that an incident at your company may result in data loss for other businesses. If a leak occurs because you are at fault, then the other parties are likely to seek legal recourse against you, increasing your damages from the incident.
- Likewise, do not forget that partners and contractors can leak your data in incidents that you cannot influence in any way.
