 RSAC
RSAC
“Excuse me, sir, do you have a moment to talk about security updates?”
“Nope, too busy installing patches.”
Seriously, though, it’s worth pausing to think about how effectively (or not) you are managing patches.
In a perfect world, you would install all patches for all software in use at your company as soon as they rolled out. But in real life, things are a little more complicated, and there’s never enough time for all patches — so you have to prioritize. But how best to do it?
At the RSA Conference 2019, Jay Jacobs of the Cyenta Institute and Michael Roytman of Kenna Security presented a study entitled “The Etiology of Vulnerability Exploitation.” The well-argued report addressed what vulnerabilities are worthy of increased attention and how to dramatically improve patch installation and security update strategy.
The basic premise is that not all vulnerabilities are exploited in practice. Assuming that’s true, a great many updates can safely be pushed back, giving priority to vulnerabilities that really can (and most likely will) be used in an attack. But how does one distinguish “dangerous” vulnerabilities from the “mostly harmless” variety?
Armed with descriptions from the CVE (Common Vulnerabilities and Exposures) database and publicly available exploit databases, as well as data from vulnerability scanners and IPS/IDS systems (a total of 7.3 billion attack records and 2.8 billion vulnerabilities in 13 million systems), the researchers built a model that handles the task pretty well. To put that into perspective requires a small bit of analysis of the vulnerability landscape.
How many CVEs exist in the wild?
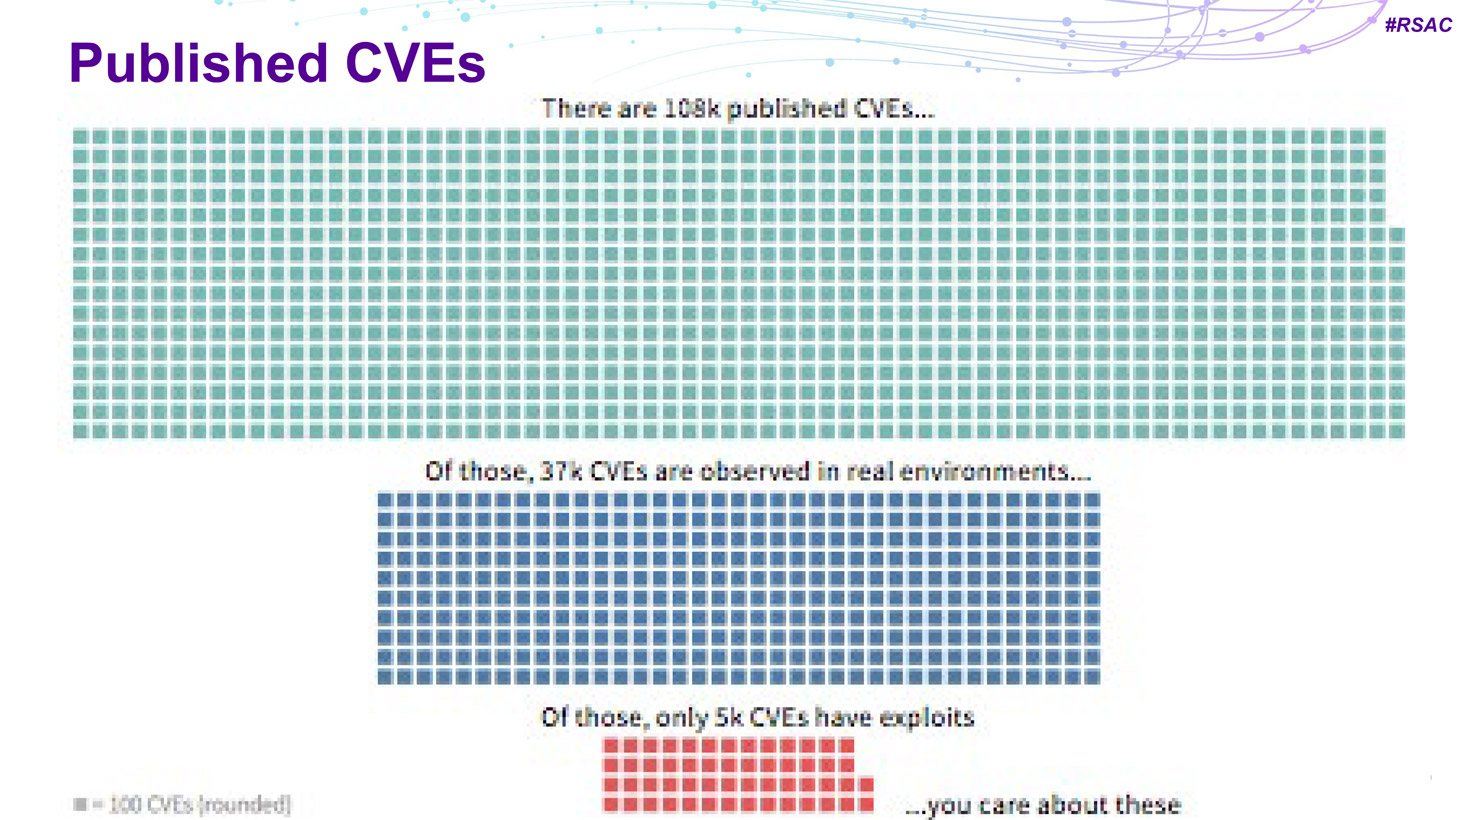
Any information security expert will tell you that the number of known vulnerabilities is huge. But not many (if any) know the precise figure. At present, about 108,000 CVEs have been published.
Bear in mind also that in the past couple of years, the rate of monthly publications has risen: If during the years 2005–2017 about 300–500 CVEs were published every month, at the end of 2017 the average monthly value shot past 1,000 and has stayed that high ever since. Think about it: That’s dozens of new bugs every day!

The existence of an exploit generally becomes known either shortly before or immediately after the relevant CVE is published. There are exceptions, but in most cases the window is plus or minus two weeks around the date of CVE publication. So CVEs demand a quick response.

It goes without saying that update install rates lag somewhat behind. On the average, a month after detection only a quarter of vulnerabilities are patched. It takes 100 days to eliminate half, and a quarter remain unpatched a year later.

More than two-thirds of unpatched vulnerabilities exist in products from just three vendors. No marks for guessing which vendors and which products:


Meanwhile, 77% of CVEs have no published exploit. Also of interest is that not all published vulnerabilities are encountered in real world environments — only 37,000 of the 108,000 CVEs in existence. And only 5,000 CVEs simultaneously exist in the wild and are exploitable. It is these vulnerabilities that should em> be prioritized — they just need to be correctly identified.
Existing patching strategies
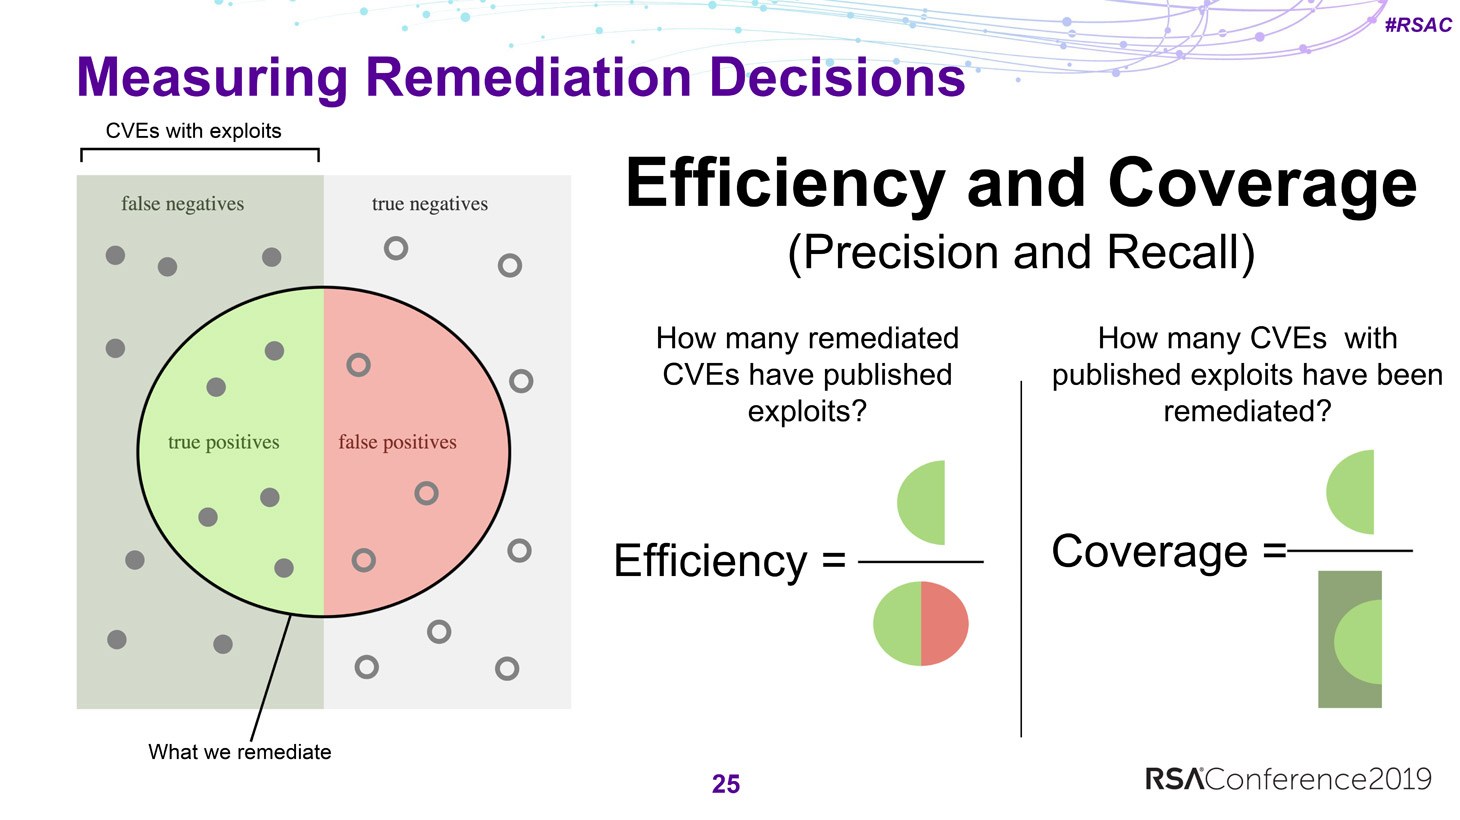
The researchers measured the relevance of the patching strategies against two metrics: The share of “dangerous” vulnerabilities in the total number of patched ones (efficiency), and conversely, the share of patched vulnerabilities in the total number of “dangerous” ones (coverage).
If this picture looks familiar, that’s probably because it’s nothing new
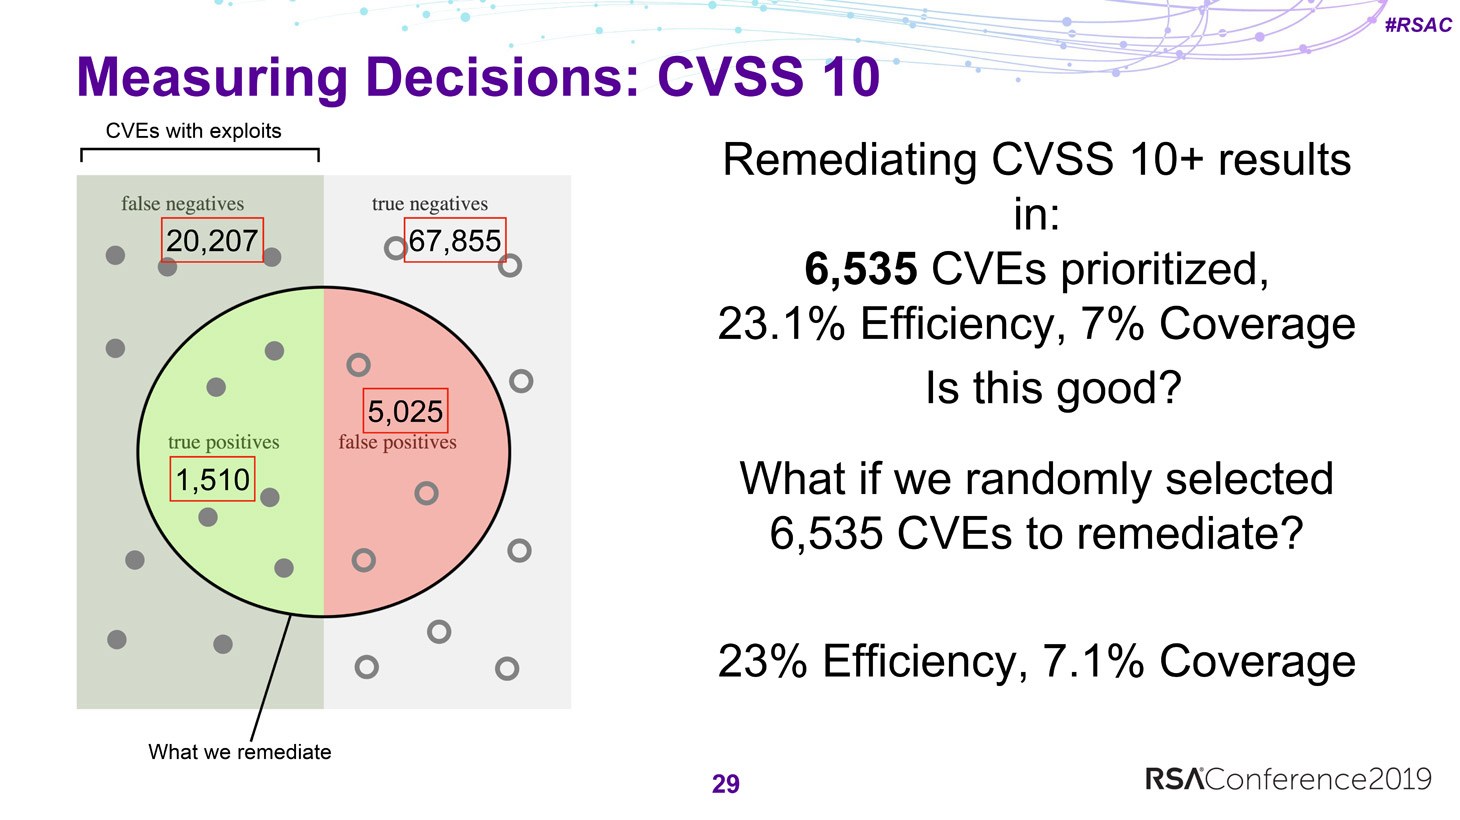
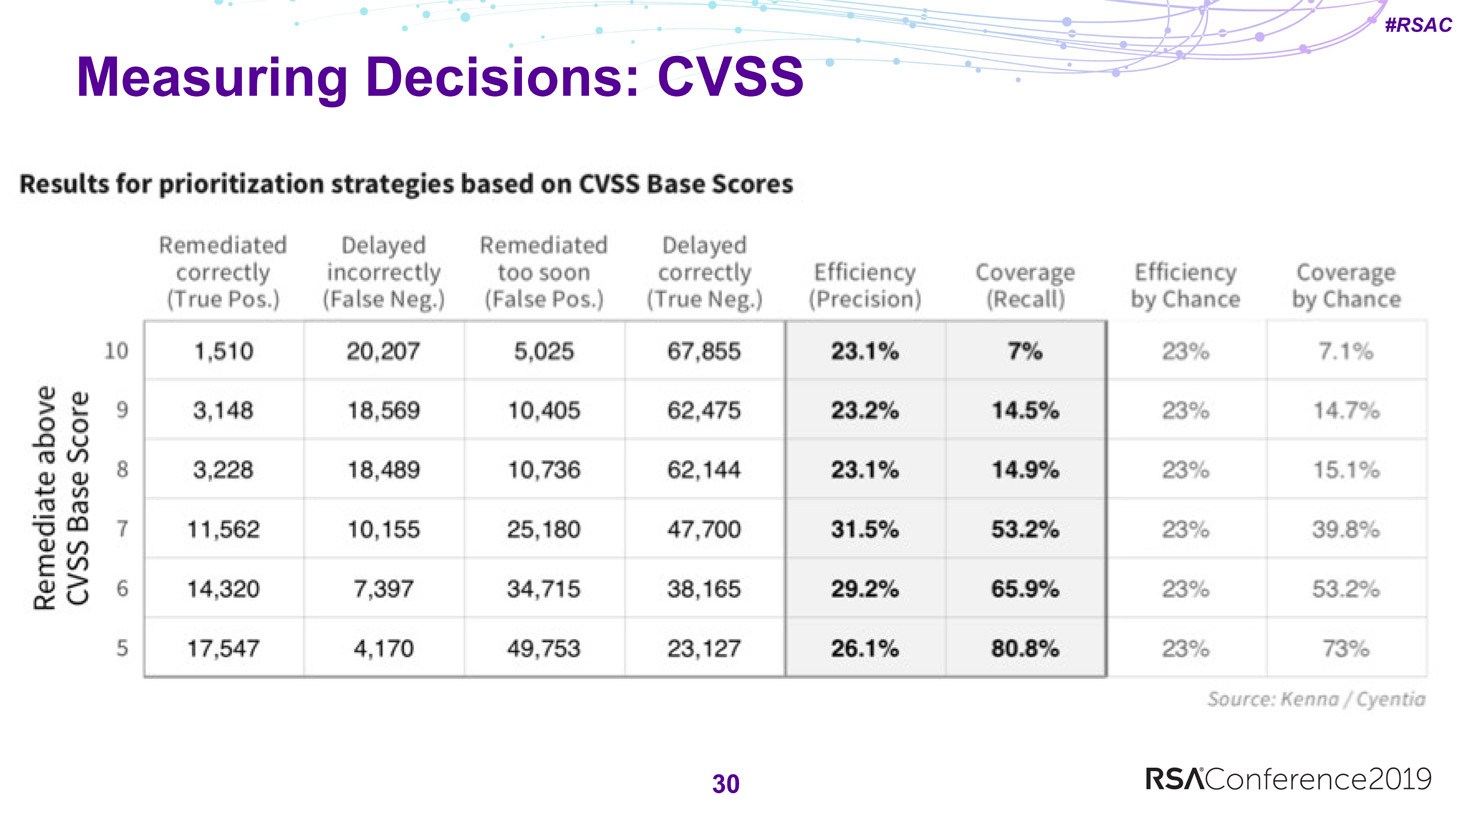
One of the generally accepted patching strategies is based on the Common Vulnerability Scoring System (CVSS), whereby priority is assigned to CVSS scores above a particular value. Calculating the efficiency and coverage for CVSS 10 gives 23% and 7%, respectively. Interestingly, the very same result (at least by these metrics) can be achieved by randomly installing patches.
The most common approach — patch everything with a “high” CVSS score (7 or above) — produces markedly better results. This approach is not bad on the whole, but it’s time-consuming because it means having to prioritize the installation of a large number of patches.
An alternative strategy would be to prioritize patching by vendor. After all, developers have different ratios of the number of actual exploits to the total number of CVEs, so it would be logical to prioritize those whose products contain vulnerabilities that are more likely to be exploited in practice.
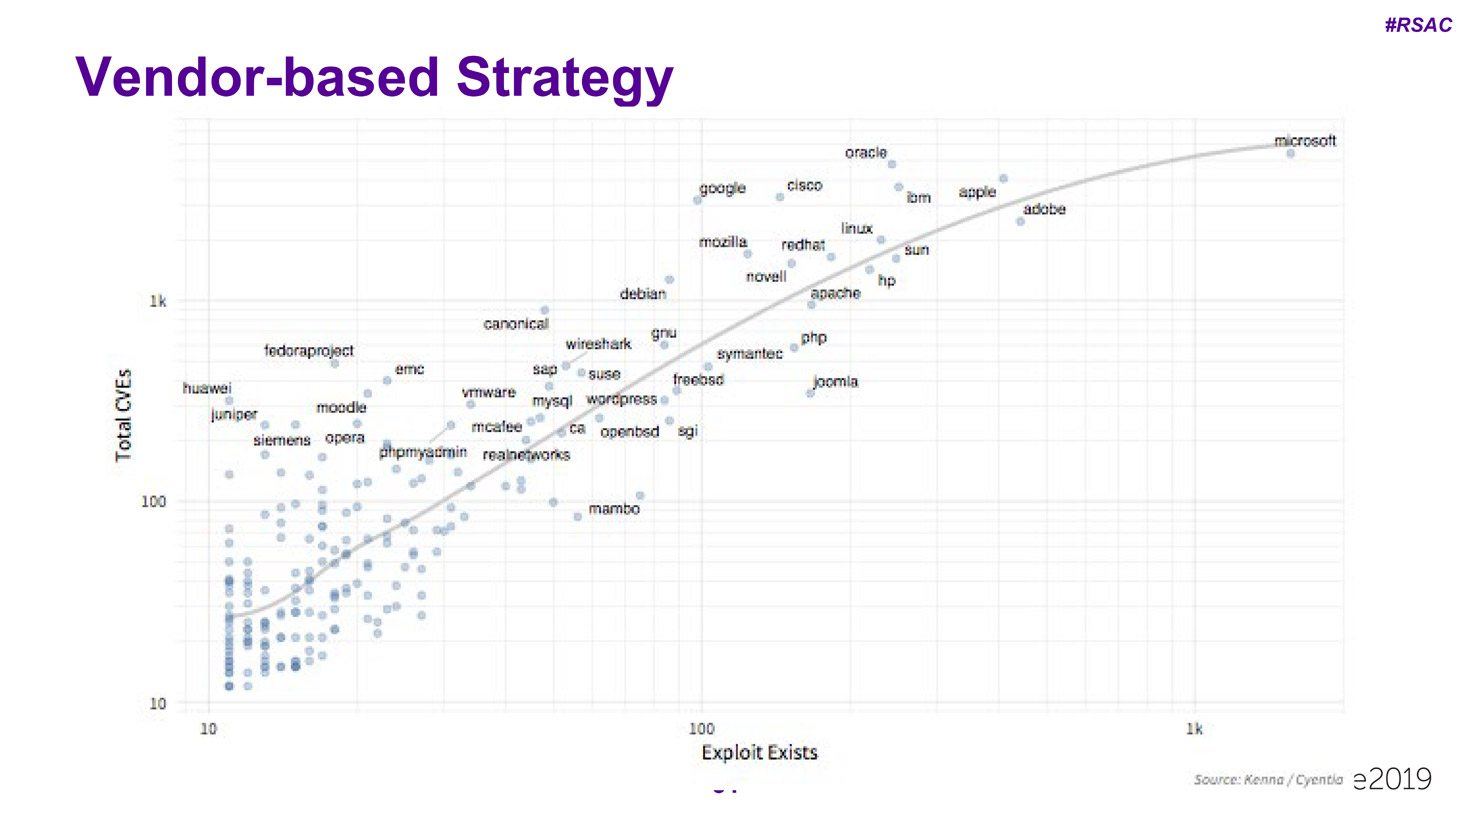
However, based on efficiency and coverage, this strategy turns out to be worse than random patching — it’s about half as effective.

So in the long run, this approach is even less relevant than one based on CVSS.
Probability computation model for vulnerability exploitation
This brings us back to the model built by the researchers. Comparing data from the CVE descriptions, publicly available exploit databases, and IPS/IDS systems, the team was able to identify a set of signs influencing the probability of a vulnerability being exploited in practice.
For example, on the one hand, signs such as a CVE reference from Microsoft, or the presence of an exploit in Metasploit, drastically increase the likelihood of exploitation of the vulnerability in question.

Some signs, on the other hand, reduce the probability of exploitation — such as a vulnerability being in the Safari browser, an exploit that was published in the ExploitDB database (which is not very convenient for practical purposes), the presence of the terms “authenticated” or “double free memory” in the CVE descriptions, and others. Combining these factors, researchers could compute the probability of any particular vulnerability being exploited.

To verify the accuracy of the model, the researchers compared their predictions with data from real attacks. Here’s what they found:
- For vulnerabilities with minimal exploitation probability, the model works well.
- The model is inclined to overestimate the likelihood of exploitation for vulnerabilities with average predicted probability.
- For vulnerabilities with high exploitation probability, the model tends to underestimate the risk.

With that said, the model is not perfectly accurate, but it works on the whole. On this basis, the researchers created three patching strategies: highly efficient, balanced, and maximum coverage. The “balanced” strategy, for example, achieves twice the efficiency of CVSS 7+ with better coverage (63% vs. 52%) and half the effort (that is, half the number of installed patches). Something worth considering, isn’t it?

Lastly, some tips from the researchers about what to do:
- Think about whether you use anything other than CVSS in your patching strategy.
- Explore how open/closed vulnerabilities are logged in your infrastructure.
- Start collecting data from your sensors about exploits used in attacks against your resources.
- When you have collected a significant amount of data, use it to calculate efficiency, coverage, and effort scores for your infrastructure.
- Compare the values with other prioritization strategies.
We agree with the researchers that manually patching everything without a clear strategy is a waste of resources. However, our approach is a bit different: Kaspersky Systems Management (part of the Kaspersky Security for Business solution) employs vulnerability monitoring and patch installation subsystems.
They make it possible to quickly identify, prioritize, and close vulnerabilities. In addition to CVSS scores, our prioritization uses information from the Kaspersky Security Network. For example, if our systems see that a vulnerability is currently being exploited, its priority increases. More details about the technology are available here.

 Tips
Tips